FastFlood Input Data
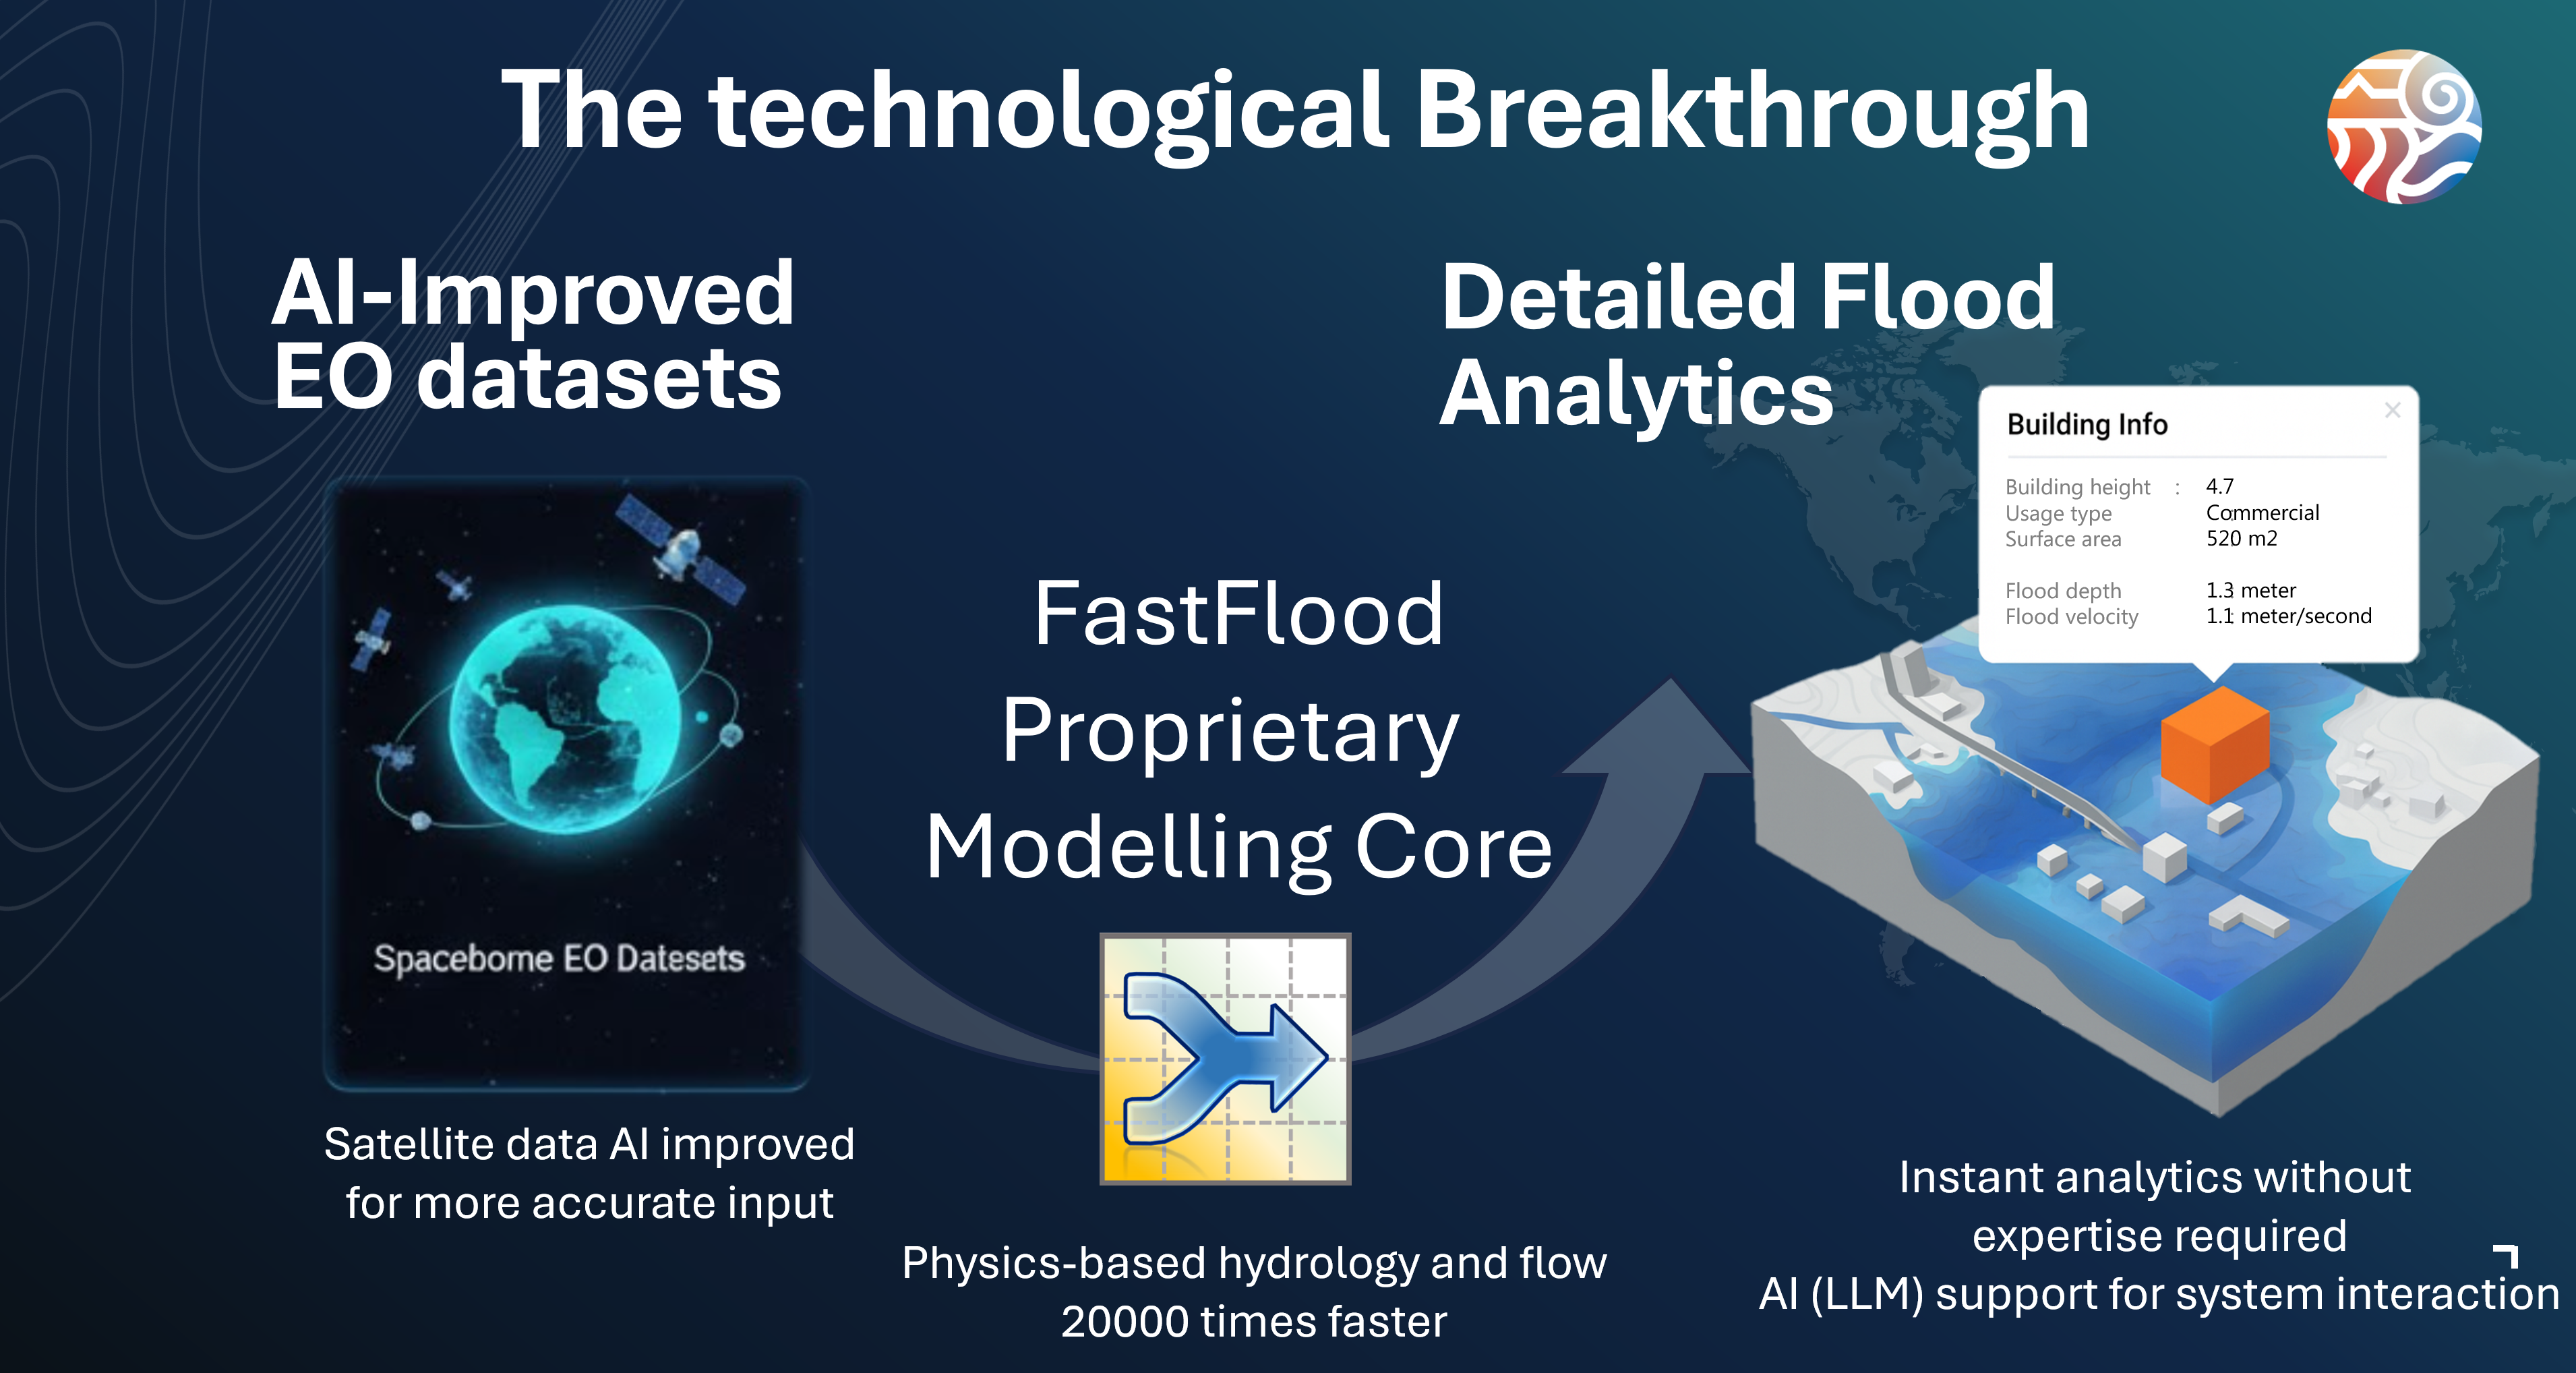
FastFlood provides major breakthroughs in high-quality global datasets. It leverages Earth Observation (EO) data, and global collections of observational data and measurement together with innovations in AI-driven improvements to quality and accuracy.
Finally, the consistent global collection of data allows for on-the-fly setup of a flood model in seconds, anywhere on earth.
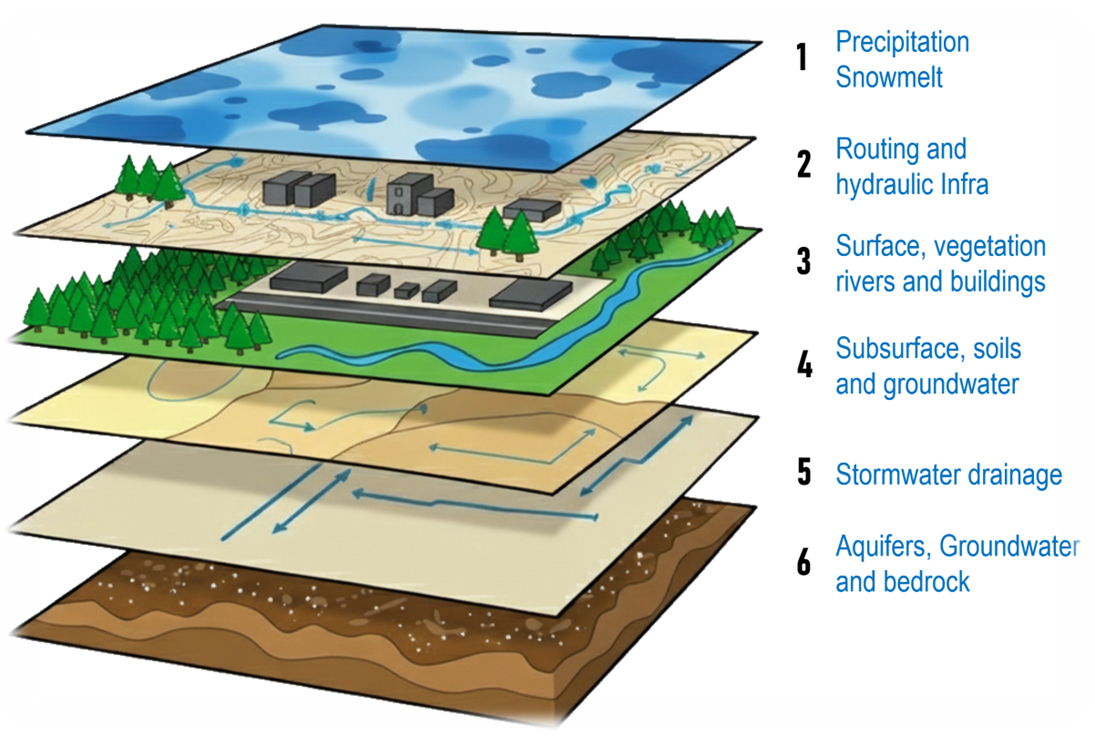
The data consists of several categories, that are all combined to feed into the hydrological, routing and hydraulic components of the model.
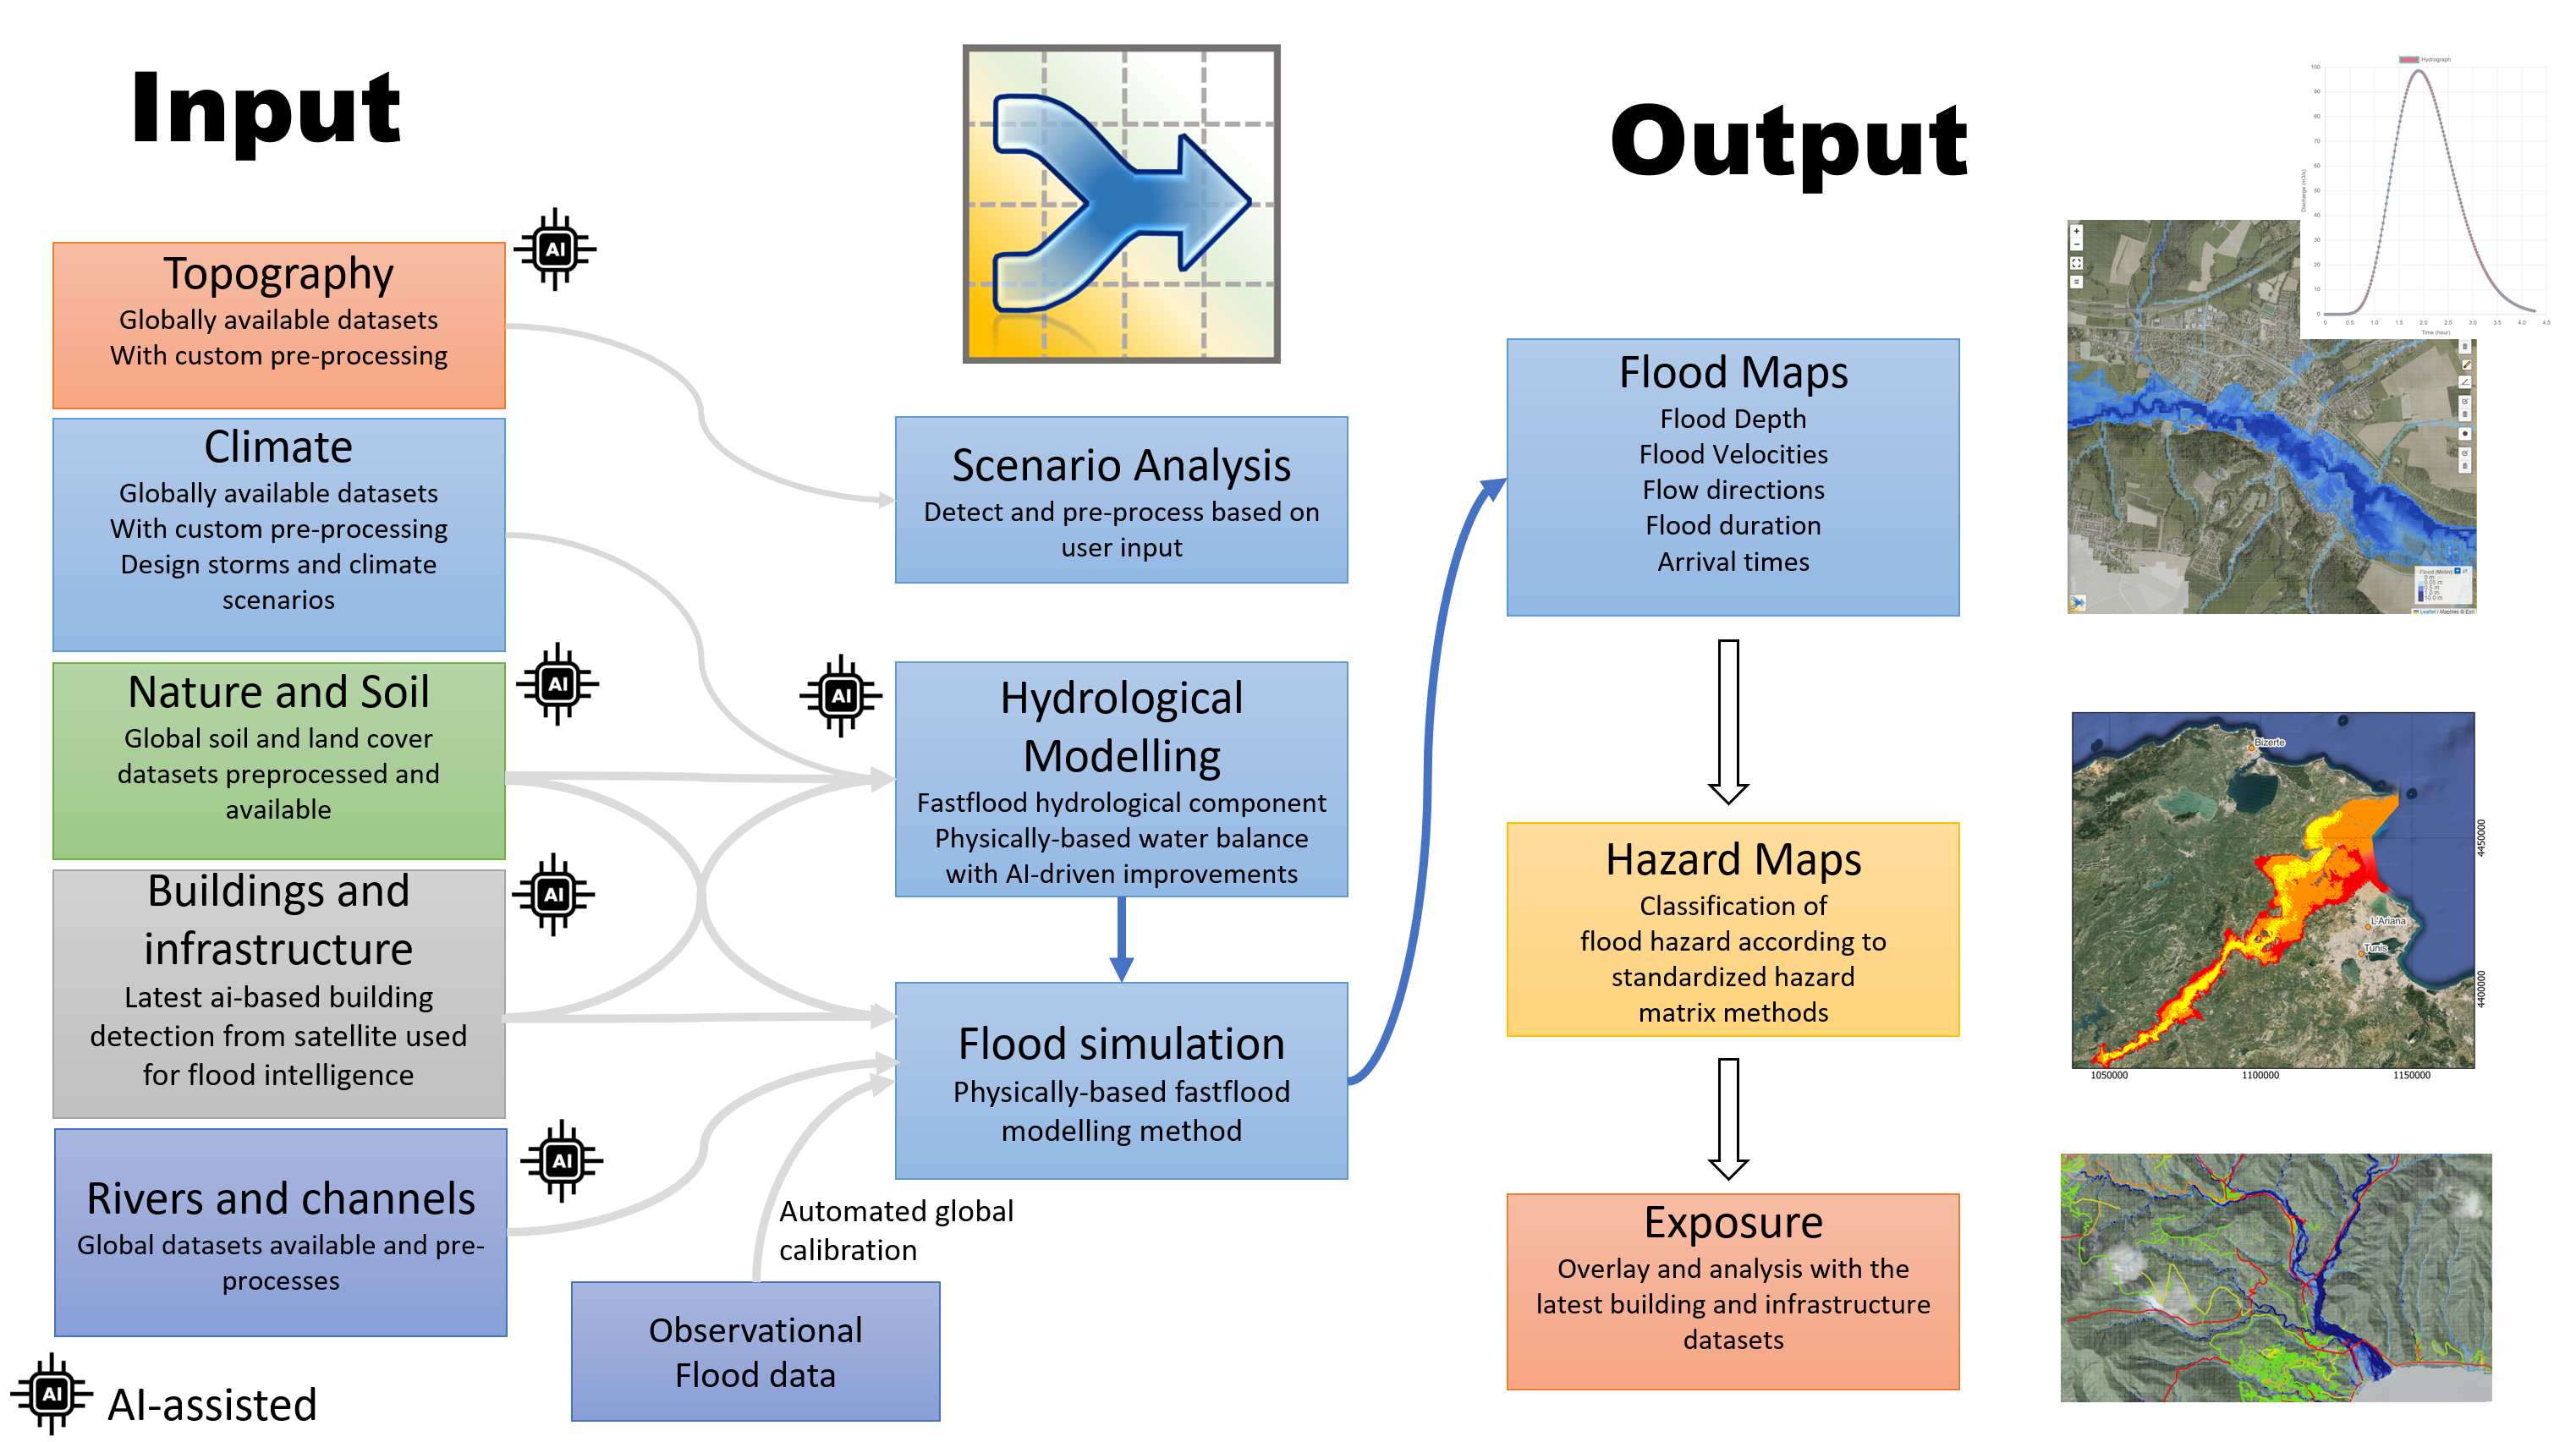
Global Data Sources
Our modelling framework integrates a wide range of satellite observations, global datasets, and in-situ measurements to accurately simulate hydrological and flood processes anywhere in the world. By combining Earth observation data, global reanalysis products, and AI-enhanced datasets, we build a consistent and scalable representation of terrain, climate, soil, and water systems.
Below is an overview of the key data categories used in the platform.
Terrain and Surface Elevation
Accurate terrain representation is fundamental to reliable flood modelling. We integrate multiple global and national elevation datasets.
For global coverage we use the Copernicus DEM (GLO-30) and EEA DEM, both derived from the TanDEM-X mission. These datasets provide consistent global elevation data used to determine slopes, drainage patterns, and flood propagation pathways.
Where available, we integrate high-resolution LiDAR elevation models. Our platform currently includes 1-meter LiDAR terrain data for more than 21 countries, significantly improving hydraulic accuracy in flood-prone regions, urban environments, and river floodplains.
These elevation models are used to derive:
-
Flow routing networks
-
Catchment boundaries
-
Surface slope and flow direction
-
Hydraulic floodplain geometry
Land Cover and Surface Roughness
Surface characteristics strongly influence water flow, infiltration, and flood propagation.
Land cover information is derived primarily from the Copernicus WorldCover 10 m dataset, based on Sentinel-1 and Sentinel-2 satellite imagery. Each land cover class is linked to hydraulic roughness parameters (Manning’s n) based on established literature values.
Vegetation structure is further refined using:
-
Global forest cover datasets
-
Canopy height products
-
Sentinel-2 derived vegetation metrics
These datasets allow the model to estimate leaf area index (LAI), which is used in the hydrological component of the system to simulate rainfall interception and evapotranspiration processes.
Meteorological Forcing and Precipitation
Meteorological conditions are represented using a combination of global reanalysis products and satellite precipitation observations.
The core atmospheric forcing dataset is ERA5-Land, the fifth-generation global reanalysis from ECMWF. ERA5-Land provides hourly estimates of atmospheric and land surface variables on a grid of approximately 10 km resolution from 1940 to near real-time.
This dataset supplies:
-
Surface temperature
-
Radiation forcing
-
Soil moisture
-
Humidity
-
Wind fields
For precipitation we combine ERA5 with GPM IMERG, which provides multi-satellite precipitation estimates at 0.1° (~10 km) resolution every 30 minutes. IMERG integrates observations from multiple satellite sensors and includes early, late, and final products calibrated against ground observations.
Together these datasets form the basis for:
-
Rainfall forcing in hydrological simulations
-
Statistical rainfall analysis
-
Extreme precipitation characterization
Climate Change Scenarios
Future climate projections are incorporated using downscaled outputs from the CMIP6 climate model ensemble.
Extreme precipitation changes are quantified using Generalized Extreme Value (GEV) analysis across a set of 20 climate models. This segmented-window analysis produces change ratios for extreme precipitation events across multiple time horizons:
-
Present day
-
2030
-
2045
-
2060
-
2075
-
2090
-
2100
These ratios are applied to present-day design rainfall events using bicubic spatial interpolation, allowing the system to generate future climate adjusted design storms corresponding to specific return periods and event durations.
Soil Properties and Infiltration
Soil behaviour plays a key role in runoff generation and subsurface flow.
We use SoilGrids v2.0, a global soil mapping system developed by ISRIC. SoilGrids provides global predictions of soil properties at 250 m resolution, based on over 230,000 soil profiles and environmental covariates.
The dataset includes:
-
Soil texture
-
Organic carbon content
-
Bulk density
-
pH
-
Depth to bedrock
Using these inputs, pedotransfer functions (Saxton et al., 2006) are applied to estimate hydraulic soil parameters such as:
-
Field capacity
-
Saturated hydraulic conductivity
-
Soil water retention curves
To estimate the current moisture state of soils, we incorporate SMAP satellite soil moisture observations, which provide L-band microwave retrievals of near-surface soil moisture.
Together these datasets define infiltration capacity and initial moisture conditions for the hydrological model.
Rivers and Hydraulic Routing
River discharge and large-scale hydraulic routing are informed using the Global Flood Awareness System (GLOFAS) operated by ECMWF and the Copernicus Emergency Management Service.
GLOFAS provides:
-
Global river discharge forecasts
-
Ensemble streamflow predictions
-
Flood hazard information
These datasets operate at approximately 0.05° spatial resolution and are forced by ERA5 meteorological data.
To improve accuracy, we apply bias correction using in-situ discharge measurements from the Global Runoff Data Centre (GRDC).
Historical flood extents used for calibration and validation are derived from:
-
Global Surface Water Explorer (GSWE)
-
Global Flood Database
River geometries are constructed using a combination of:
-
HydroBASINS river networks
-
Global River Mask datasets derived from Landsat imagery
Local hydraulic structures such as culverts are detected from OpenStreetMap data and automatically integrated into the drainage network.
Stormwater Drainage and Flood Protection
Flood protection infrastructure varies widely across the globe. To represent these systems, we integrate the FLOPROS global protection level database.
This dataset describes the typical flood protection level for different regions, which is used to estimate the capacity of:
-
Urban stormwater drainage systems
-
Levee and flood defense systems
Urban areas are identified using a combination of:
-
OpenStreetMap urban features
-
Copernicus WorldCover built-up classifications
In urban regions, a stormwater drainage system is introduced with a capacity equivalent to the design event associated with the FLOPROS protection level.
For river systems, levee effects are incorporated by adjusting channel geometry. Empirical power-law relationships between drainage area and river depth are rescaled according to regional protection levels using observed river cross-section datasets.
Buildings and Urban Infrastructure
Buildings and roads strongly influence both surface flow routing and infiltration capacity.
Urban infrastructure data is primarily obtained from OpenStreetMap vector datasets, supplemented with Sentinel-2 derived urban classifications and optional building height products.
For modelling purposes:
-
Buildings and roads are rasterized onto the computational grid
-
Soil infiltration capacity in these areas is reduced to near zero
-
Runoff is redirected to the stormwater drainage system
These datasets also provide the basis for exposure and impact assessment, enabling the model to estimate the potential effects of flooding on infrastructure and built environments.
AI-Enhanced Hydrological Datasets
In addition to the core Earth observation datasets, the platform incorporates AI-enhanced global hydrological datasets.
Machine learning models trained on large global station networks — including NOAA rainfall stations and GRDC river discharge measurements — are used to improve key boundary conditions in regions with limited observational data.
These AI-derived datasets include:
-
Global Intensity-Duration-Frequency (IDF) rainfall curves
-
Improved river discharge boundary conditions
-
Statistical bias correction of hydrological extremes
By combining satellite observations with global station data and machine learning, the system provides more reliable design rainfall statistics and discharge estimates, even in data-scarce regions.
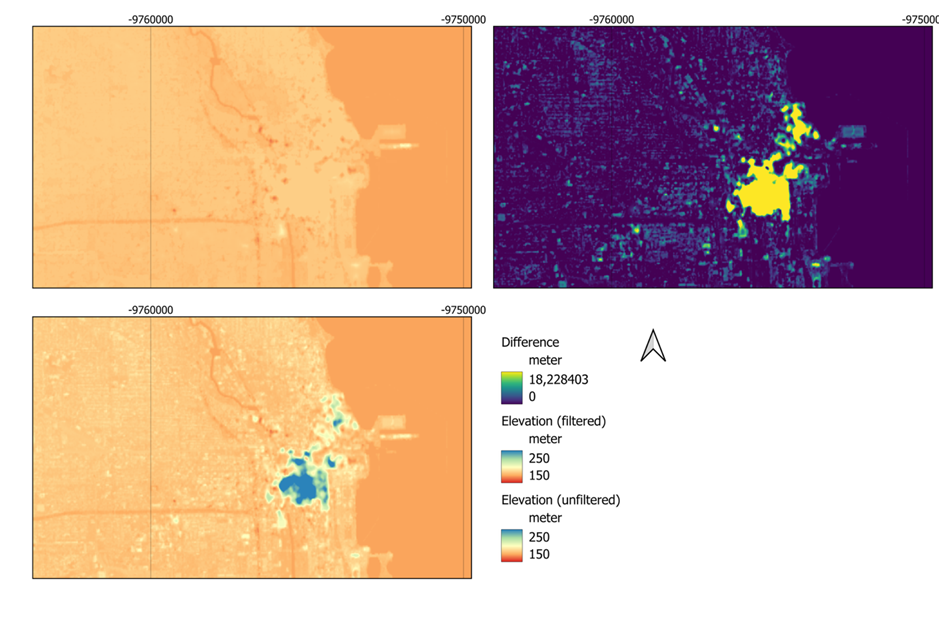
DTM Filter: Removing Buildings and Vegetation
Accurate flood modelling requires a digital terrain model (DTM) that represents the bare-earth surface. Buildings, trees, and other vegetation can artificially obstruct water flow in urban and forested areas, creating artefacts in flood simulations. To address this, FastFlood includes a DTM filter specifically designed to remove t
hese obstacles from elevation datasets.
Purpose
The DTM filter ensures that water flow paths are correctly represented by eliminating non-terrain features that may distort hydrolo
gical analysis. It is particularly useful in:
-
Urban environments with dense buildings
-
Forested regions with significant tree canopy
-
Areas where accurate flow routing and flood extent prediction are critical
Methodology
FastFlood implements the DTM filter using a sweeping algorithmic framework, similar to the method employed for hydrological terrain correction. Sweeping algorithms are computationally efficient and provide robust results with simple update rules.
Two main sweeping app
roaches are used:
-
Isolated O
-
The algorithm moves systematically across the elevation grid.
-
Each grid cell is examined and updated based on surrounding cells to remove isolated obstacles (e.g., a single building or tree).
-
The process iteratively smooths the terrain, preserving the natural slope while removing artificial spikes.
-
-
bstacle Sweep Filter
-
Progressive Terrain Sweep (if applicable)
-
Larger or clustered obstacles, such as building blocks or dense forest patches, are addressed.
-
Sweeps progressively propagate corrections across the affected regions, maintaining realistic f
-
low paths while flattening non-terrain features.
-
Benefits
-
Removes urban and vegetation artefacts from DEMs for more realistic flood simulations
-
Preserves natural terrain gradients and flow directions
-
Efficient implementation, leveraging FastFlood’s optimized sweeping algorithm
-
Compatible with global DEMs (SRTM, Copernicus 30m, WorldDEM) and user-supplied elevation data
Usage
The DTM filter is automatically available in FastFlood’s terrain processing tools. Users can apply the filter to imported DEMs before running simulations, ensuring accurate flow routing and flood depth predictions.
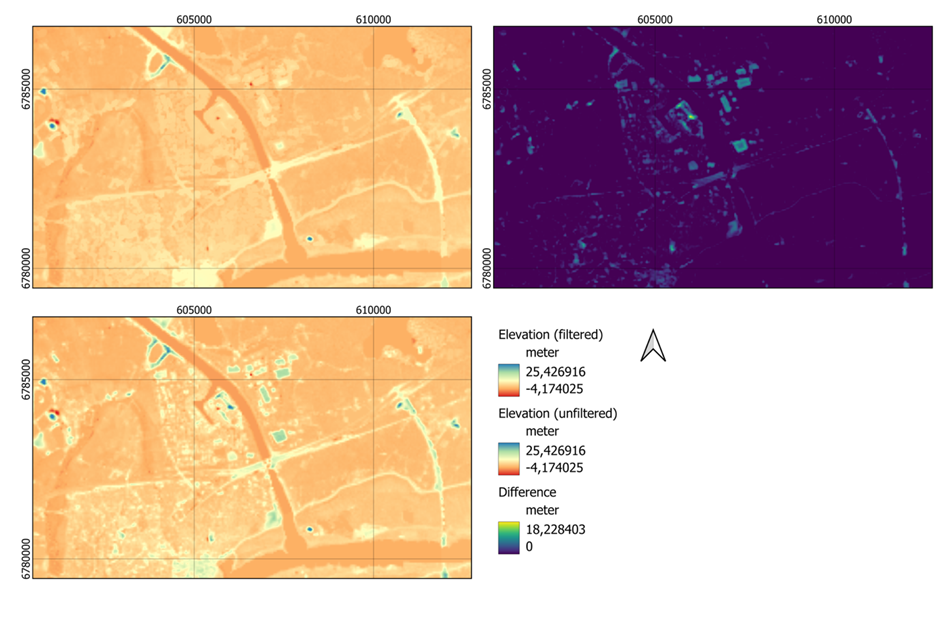
Two examples of the DTM filter built-in into fastflood applied are provided below, with the first example showing the urban center and surroundings of Chicago, USA. The second example shows a smaller rural are in the Netherlands.