Climate Change
Looking to the Future (Climate Change)
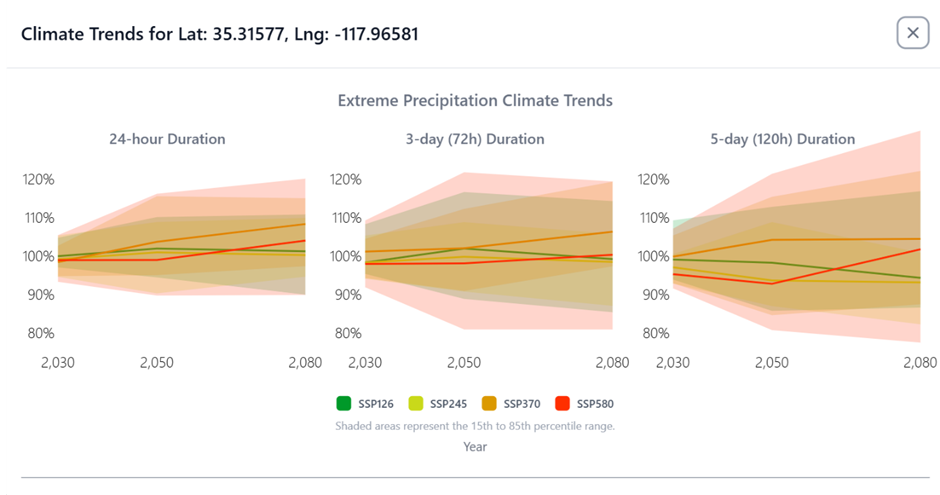
The new platform's final key feature is its ability to look into the future. How will climate change affect your 100-year storm?
IDF Curves
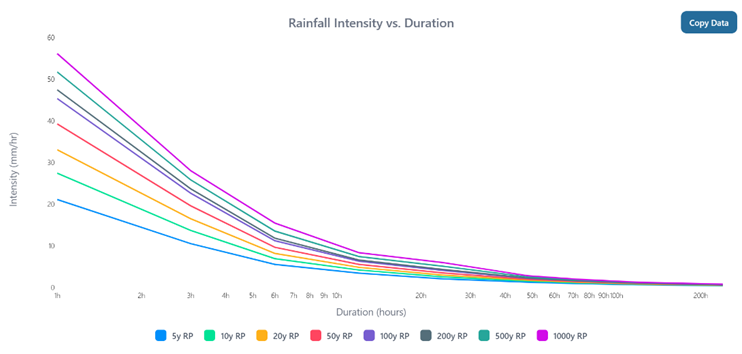
IDF curves explain how heavy rain can be, how long it lasts, and how often it happens.
IDF stands for Intensity, Duration, and Frequency:
- Intensity: how hard it rains (for example mm per hour)
- Duration: how long the rain lasts
- Frequency: how rare the rain event is (for example once every 10 years)
They are mainly used to estimate how much rain you should expect for a certain storm length and rarity, for things like drainage and flood design.
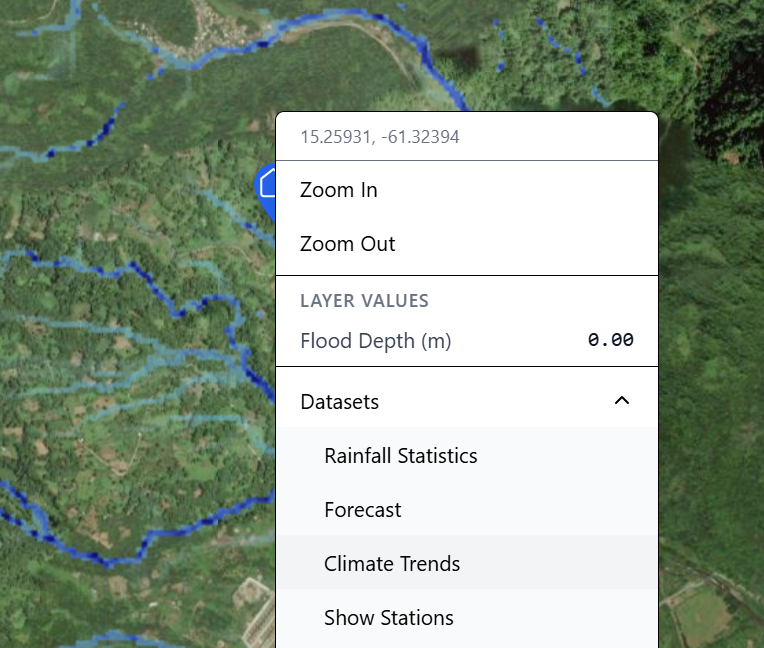
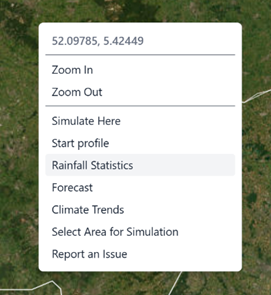
Right-mouse click and select Rainfall Statistics
to see IDF curves for that particular location
- Load Your Design Event: Open your 100-year storm simulation from Chapter 2.
- Add a Climate Scenario: Click the "Add a climate change scenario to the simulation" button.
- Choose Your Future: Select a climate scenario and a time period from the built-in options:
- Scenario: SSP5-8.5 (The "high-emissions" path)
- Year: 2050
- Run and Compare: The platform will re-run your 100-year storm, but this time it will automatically increase the rainfall intensity based on the full ensemble of downscaled CMIP6 climate models.
- Analyze the New Reality: You will instantly see a new, more severe flood map. The "Flood Hazard Timeline" analysis can show you how the probability of extreme events changes over time, giving you the data you need to plan for a changing world.