Your First Simulation
Starting the Model
You can find the platform at www.fastflood.org.
There are two primary tools,
FastFlood Global – The tool we’ll work with in this document, aimed at rapid modelling and providing information to users.
FastFlood Technical – A technical tool aimed more at detailed application of the model with custom data.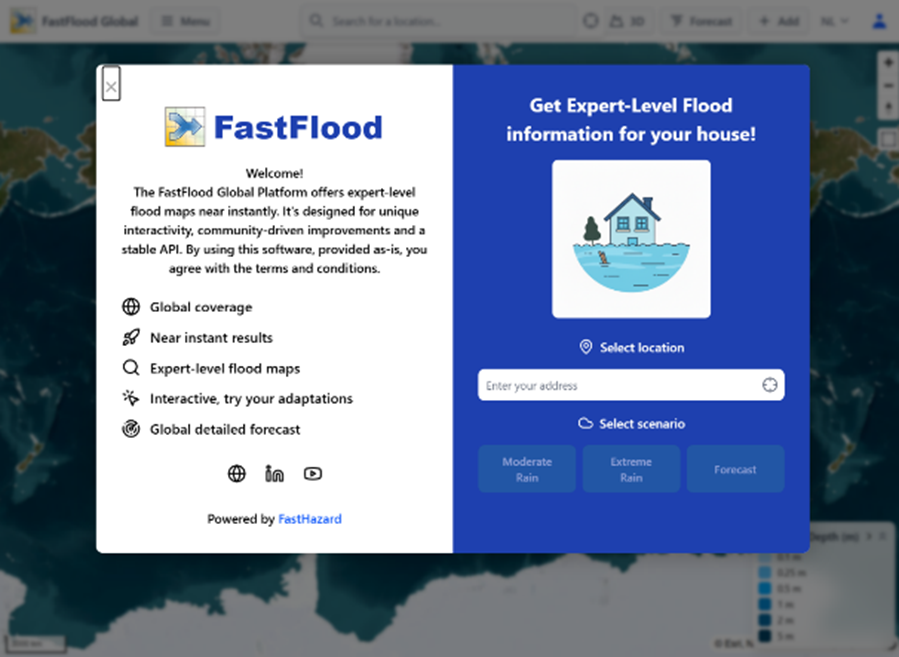
You dont need any credentials to try the software, but if you are interested in using the commercial features, please reach out https://www.fasthazard.com/contact/
Or mail us at info@fasthazard.com for temporary access.
Running a simulation
Let's start by looking at a live, real-time flood forecast. The platform does all the hard work for you.
- Find Your Location: Open the FastFlood Global platform. Use the search bar at the top to find any location in the world (e.g., "Valkenburg, Netherlands" or "Houston, Texas").
The simulation should load in a couple seconds, showing expected flood impact for the region.
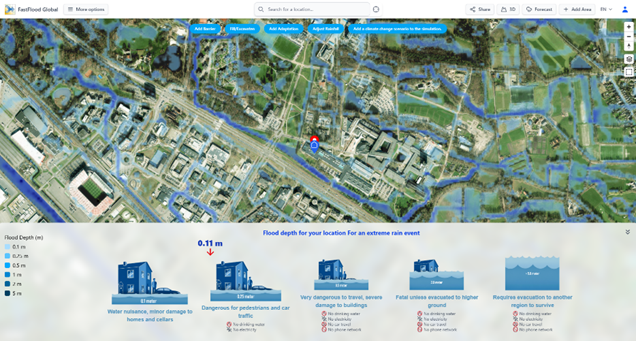
Click any location within the simulated area to see the flood depth in the bottom legend.
These numbers and their meaning are different in every region. Where some regions might see small flood depths impact society, other regions that more frequently deal with floods might be more resilient to the disruption of society’s functioning by them.
Your simulation might be empty, due to a lack of forecasted rainfall. Look for an area with higher impact and repeat the process.
2. Understand the Impact: Click any location on the map, or use the "Analysis" panel. The platform translates flood depth into simple, clear impacts:
-
- 0.1m: "Water nuisance, minor damage"
- 0.25m: "Dangerous for pedestrians and car traffic"
- 1.0m: "Fatal unless evacuated to higher ground"
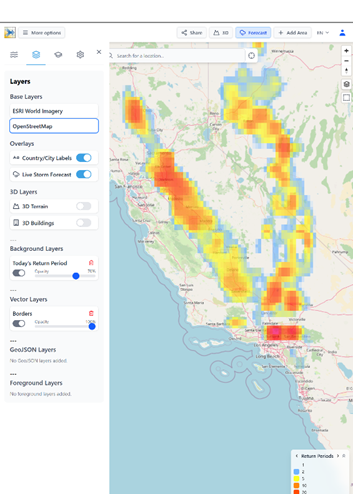
You can enable the forecast layer, showing how extreme
the precipitation in the coming 10 days is expected to be,
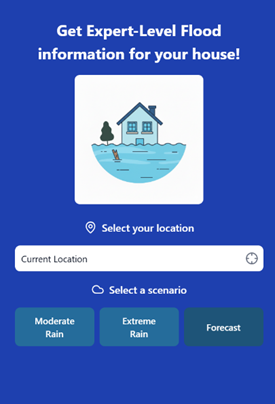
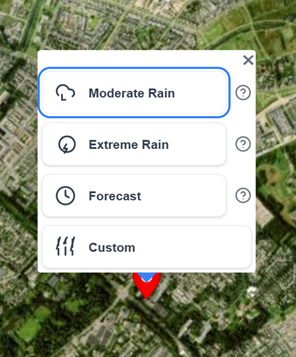
using the forecast button at the top-right of the screen. You might find another area to simulate if there is no precipitation expected for your location of choice. Just click anywhere on the map and select "Moderate", "Extreme" or "Forecast" for a quick view of the respective scenario.
By clicking anywhere on the map (outside of the current model domain) or on the marker (inside the model domain),
the simulation options show and allow you to select a type of simulation to start at that location.
To see the detailed time-forecast,
3. Click "Forecast": Select the "Forecast" button.
Now press the detailed forecast button in
the top menu.
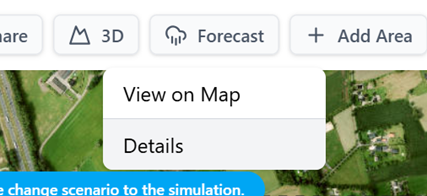
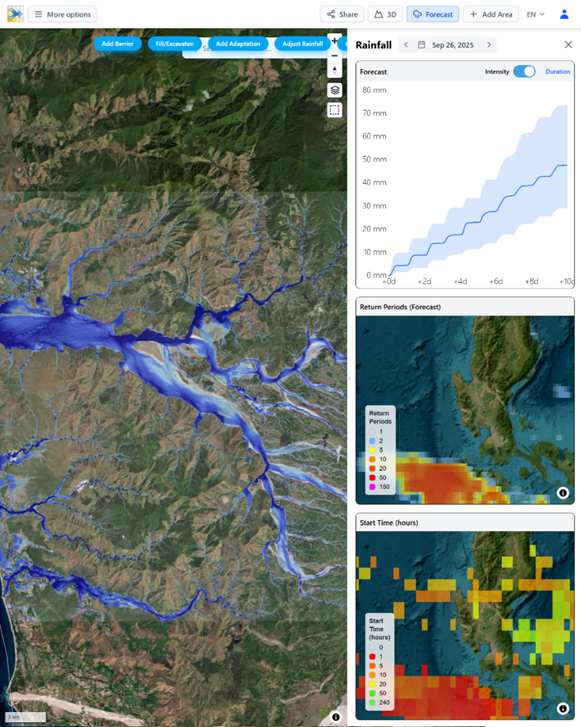
The Right panel will open, with details on the local forecast, approaching extreme precpitation, its return period (how extreme the event is) and the start time of this event within the global weather forecasts.
Precipitation Data
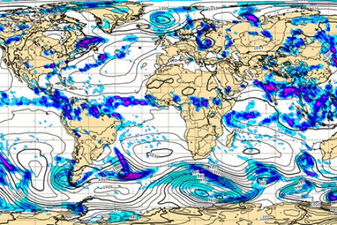
Our global platform uses the ECMWF Precipitation forecasts.
This is one of the worlds leading numerical weather prediction systems, and is available globally. Twice a day, a new detailed forecasts for the coming 10-day period is produced. While weather models, like any model, have their uncertainty, frequent incorporation of measurements helps these tools be reliable.
Models like this are not ran once, but often many times. The ECMWF runs a 50-member ensemble at 14 kilometer resolution. We analyze all of them to incorporate them into our platform directly. Using them all for flood simulations can help capture uncertainty, as the 50 members all show slight variations of the coming precipitation patterns.

❓ Questions & Answers
- How reliable is the "out-of-the-box" flood forecast for a region I know nothing about?
- Answer: The reliability varies. The model uses global datasets, which can have strong uncertainties in regions where they haven't been calibrated. However, the system is designed and calibrated for high-quality, out-of-the-box performance. For example, in an uncalibrated forecast for the 2024 Kazakhstan floods, the model's automated parameterization achieved 99.4% accuracy against satellite observations. It's best used as a high-level forecast, not a replacement for local, mandated warnings.
- The impact graphic for 0.25m of water says "Dangerous for pedestrians and car traffic." What critical local infrastructure is this simple graphic not accounting for?
- Answer: This graphic is a general guide based on water depth on the surface. It does include the effects of local storm-water drainage systems or sewers, but only in an estimated manner. In a well-designed city, these systems might have the capacity to handle this amount of water, meaning no surface flooding (and thus no impact) would occur. The model's "out-of-the-box" setup estimates this drainage capacity, but it's a source of local uncertainty.
- The forecast is based on global weather models. What is a key limitation of this data when predicting flash floods?
- Answer: The global re-analysis data used (like ERA5) is known to have low accuracy for extreme precipitation events. It particularly tends to underestimate small-scale, high-intensity storms (like localized thunderstorms) that often cause flash floods. Therefore, the model might be a bit more accurate for large, slow-moving river floods (fluvial) than for sudden, localized flash floods (pluvial).