Simulation Analysis
Simulation History
After a simulation has been started, it shows up in the top left menu,
where all previous simulations are shown. For each simulation, analysis can be carried out, and results visualized or exported.
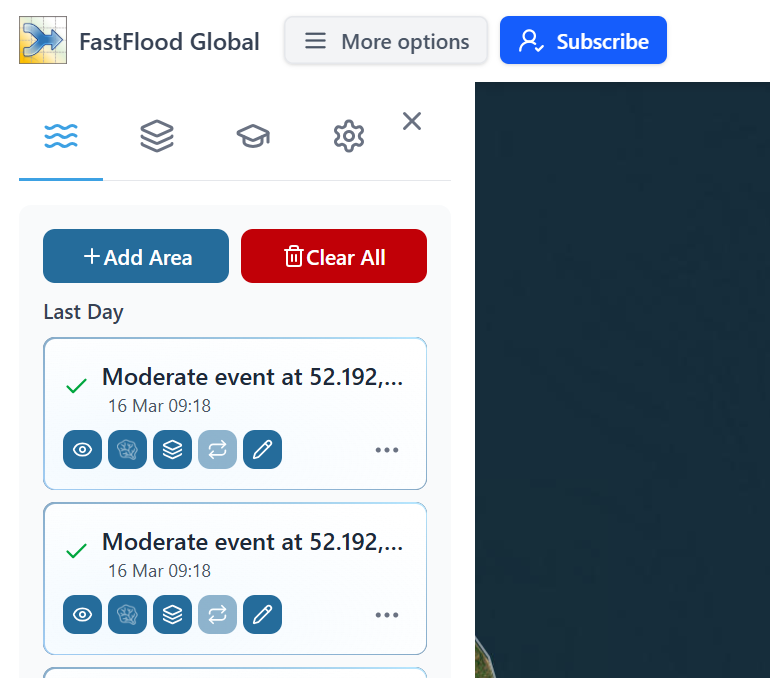
You can zoom to the model extent by pressing the more options (Three dots), and selecting zoom to model region. Or toggle the flood map by pressing the left eye icon.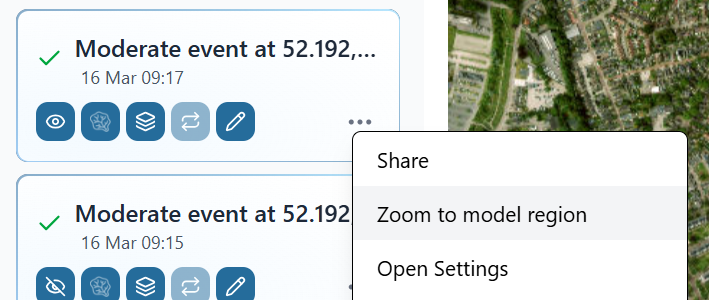
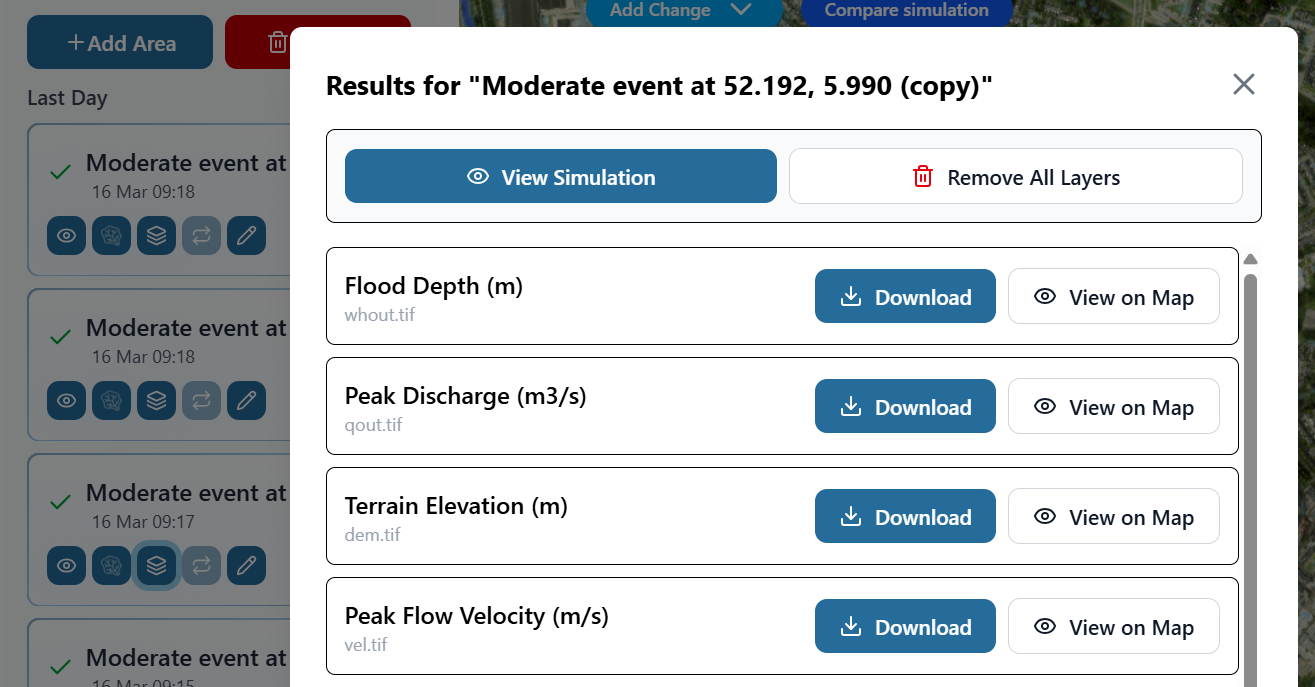
Exporting results
Press the layer icon ![]() to open the simulation output window. Each layer can be visualized or exported in an open data format (GeoTiff or GeoJSON). These files can be used with any GIS software (e.g. QGIS, ArcMap or GRASS) for further visualization or analysis.
to open the simulation output window. Each layer can be visualized or exported in an open data format (GeoTiff or GeoJSON). These files can be used with any GIS software (e.g. QGIS, ArcMap or GRASS) for further visualization or analysis.
Flow Network and discharge
Toggle the river network button (![]() ) to show the river network for the simulated area
) to show the river network for the simulated area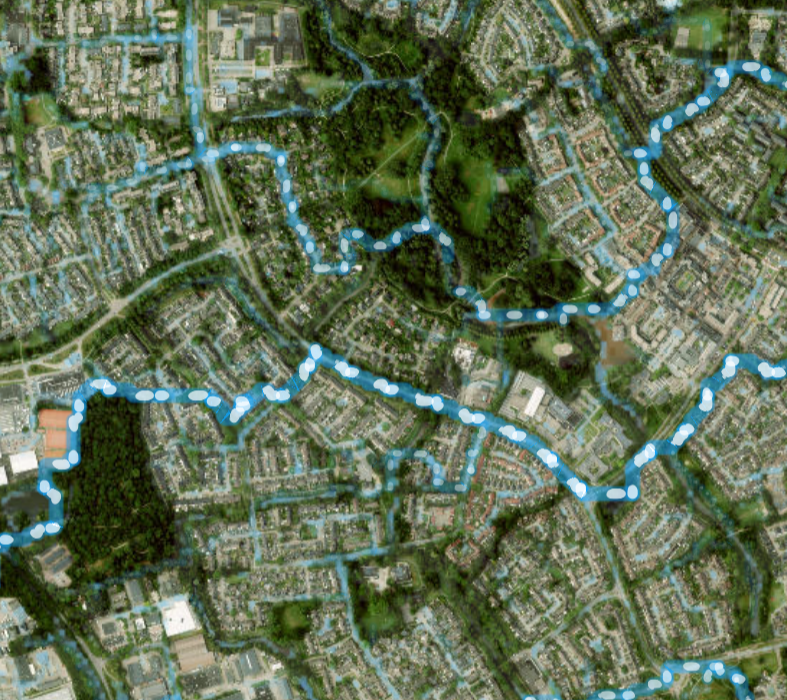
Click along any point on the network to see hydrograph and basin information at that location.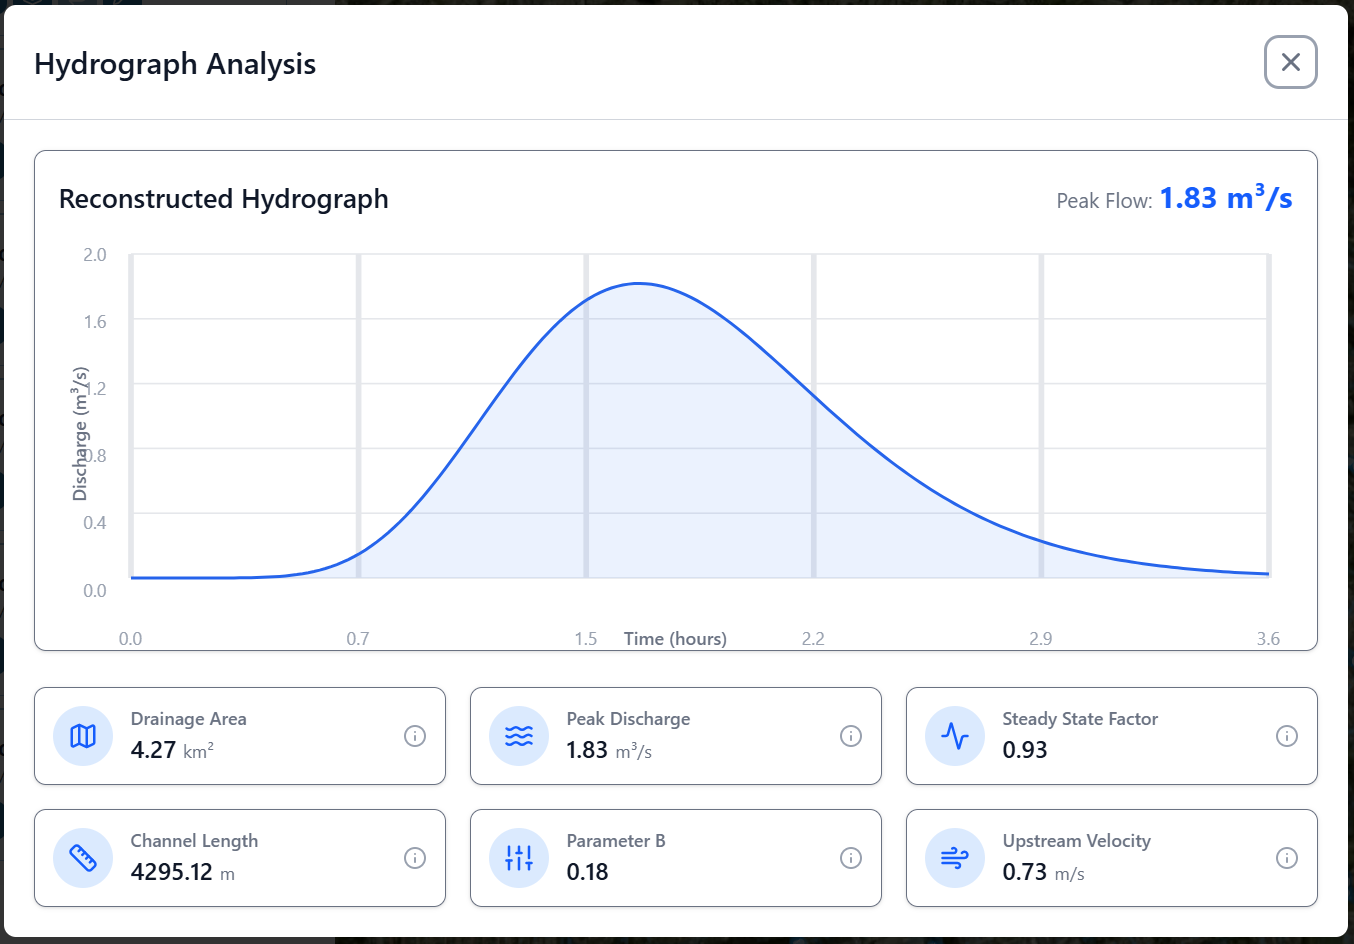
Analysis
Further analysis is available under the more options section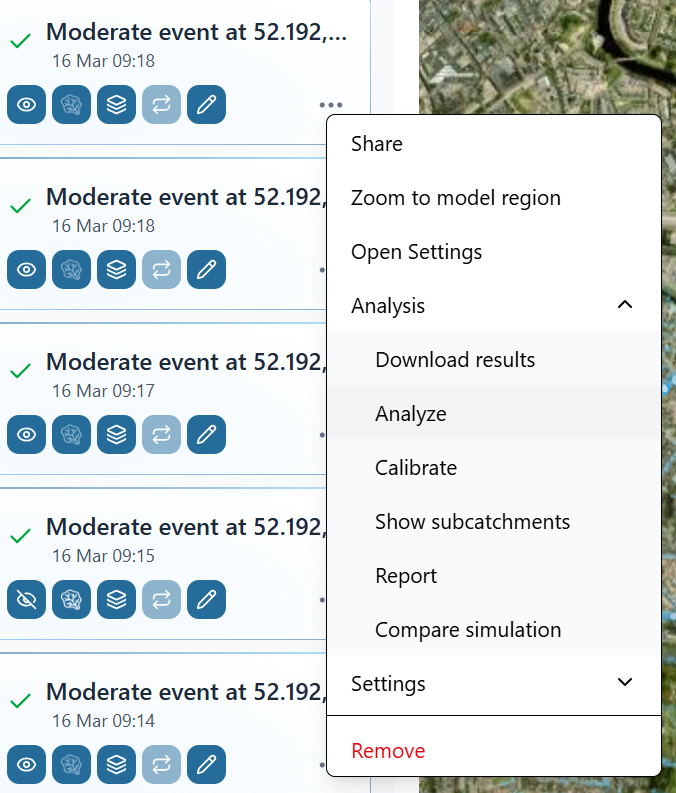
The analyze option features
- Flood statistics (custom or default value ranges for flood surfaces)
- Water balance, including rainfall, runoff, river recharge, infiltration and incoming flow.
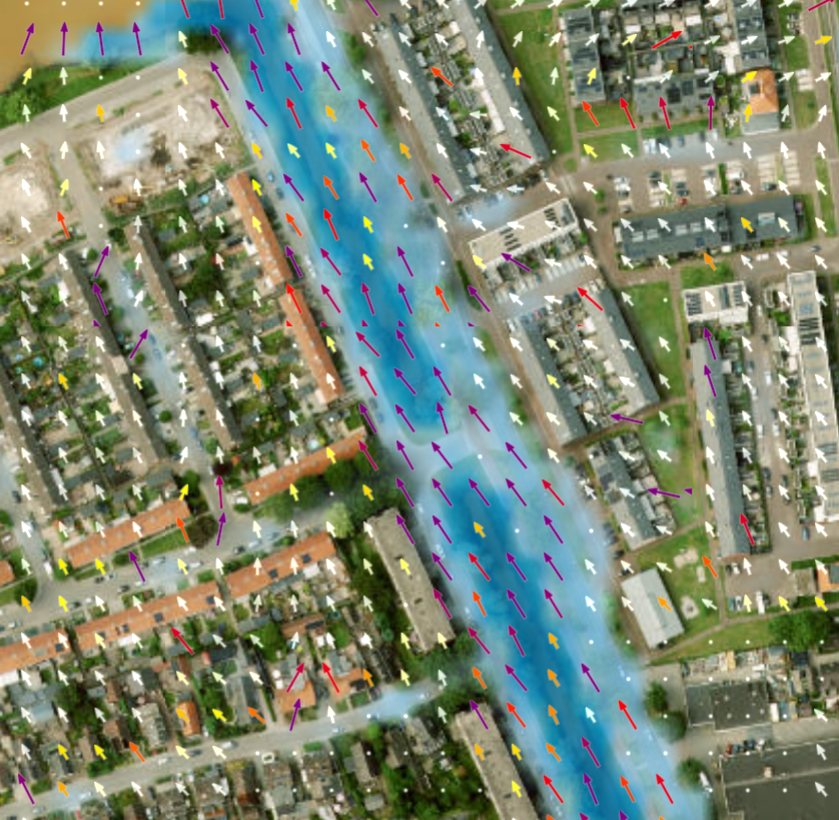
- A detailed 2D flow network.
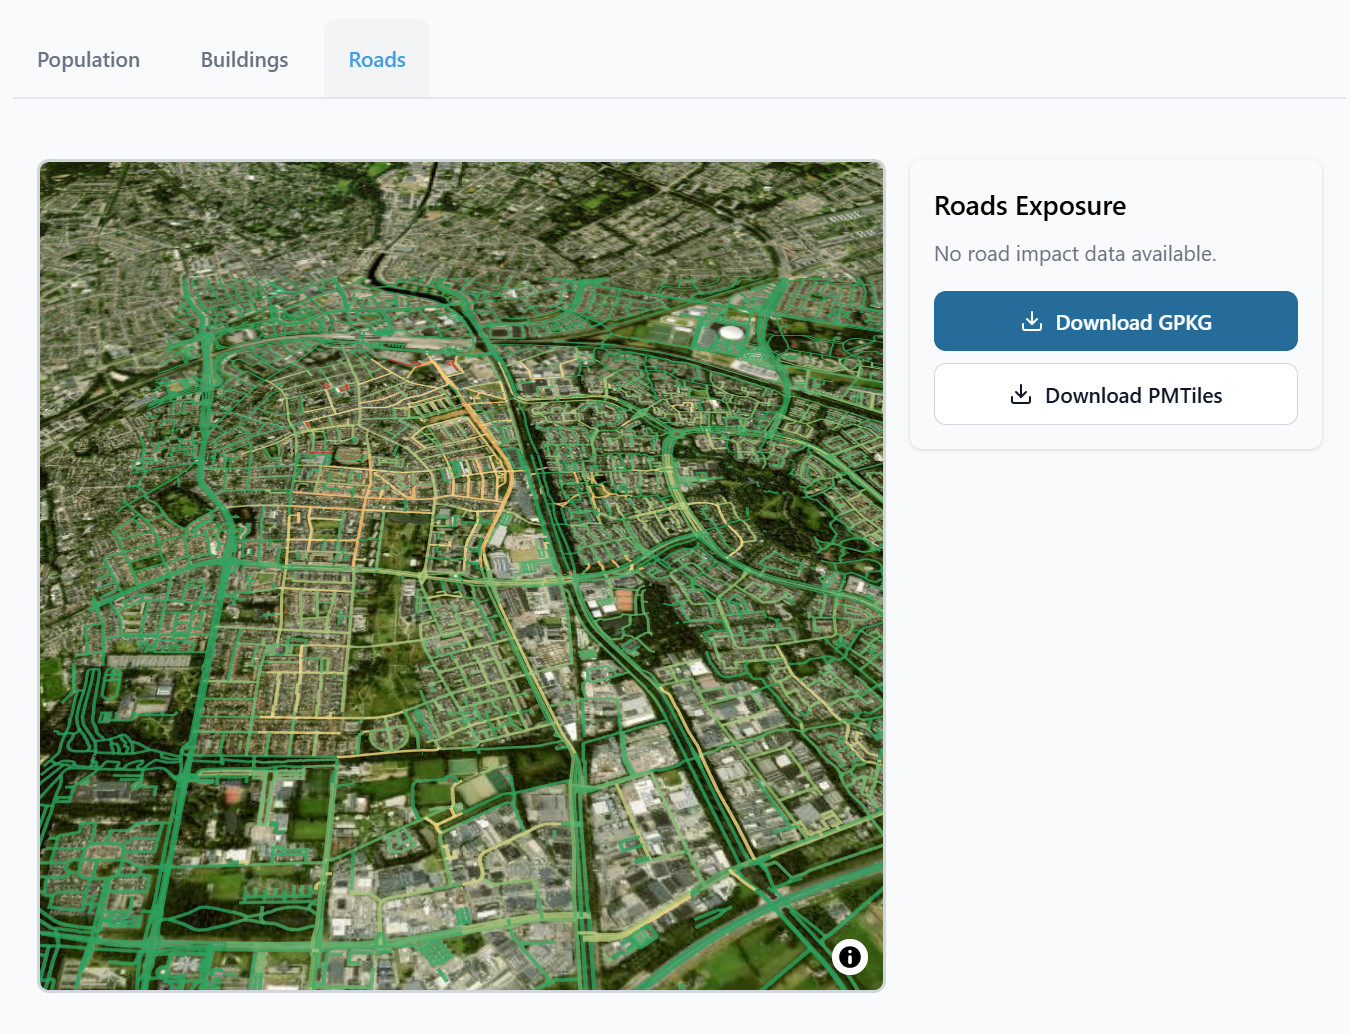
- Exposure calculations for population, buildings and road segments.