Impact
Chapter 4: Analyzing Your Impact (People and Property)
A flood map is one thing; knowing who and what is in danger is another.
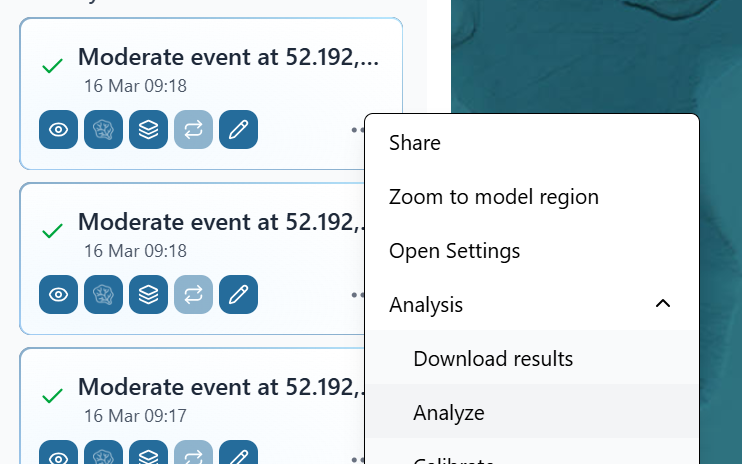
- Open the Analysis Panel: With your flood simulation active, open the "Analysis" panel. You can find this under the left menu, by pressing the three dots under the simulation in your history.
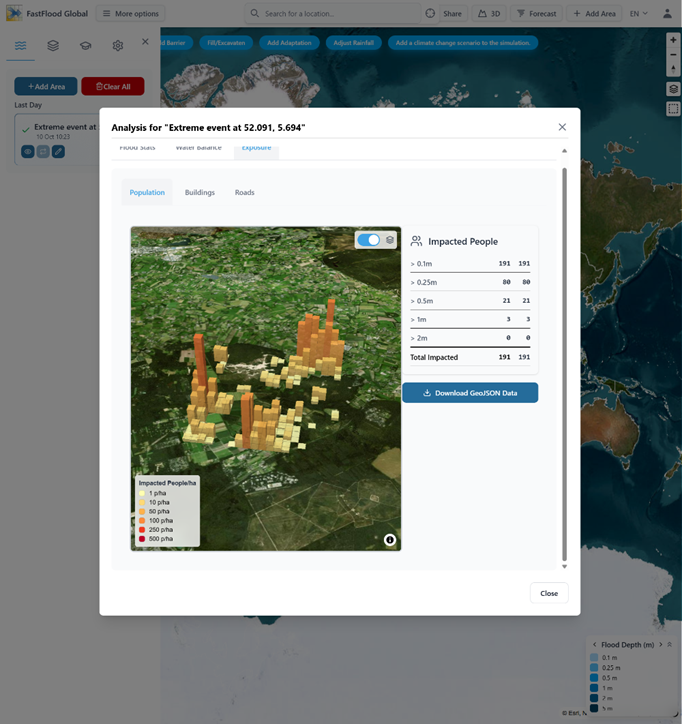
- See Impacted People: The platform can automatically analyze the flood's impact on the population, showing you a 3D map of where people are affected and at what flood depth. You get a simple table of:
- Impacted People > 0.5m: 21
- Impacted People > 1m: 3
- Total Impacted: 191
- Analyze Buildings and Roads: You can also toggle views to see the total length of roads flooded or the number of buildings impacted. This allows you to move from a simple hazard map to a true risk assessment.
❓ Questions & Answers
- Where does the data for "Impacted People" and "Buildings" come from, and what is its main limitation?
- Answer: This data is downloaded from OpenStreetMaps (OSM). Its main limitation is that its quality is highly variable. In a well-mapped city, it can be extremely accurate. In a remote rural area, the data may be incomplete or totally missing. If OSM has no data for an area, the model will report "0" impacted people or buildings, even if the area is flooded and populated.
- The analysis says a building has a "Max Flood Depth: 1.11 m." Does this mean there is 1.11 meters of water inside the building?
- Answer: Not necessarily. This number represents the peak water depth on the ground at that building's location. It is an exposure metric. It does not automatically account for a building's vulnerability, such as its foundation height (the water may be 1.11m high but still below the doorway), flood-proofing, or construction material. To know the damage inside the building, you would need to apply a "vulnerability curve" to this exposure data.
- The model calculates risk using the formula: Risk = Probability * Vulnerability * Exposure. Which of these three components is the model not providing in its automated analysis?
- Answer: The model does not automatically provide the Vulnerability component.
- It provides the Hazard (flood depth) and its Probability (e.g., a "1-in-100-year" event).
- It provides the Exposure (e.g., "191 impacted people" or "30 impacted buildings" from OSM).
- It does not know the vulnerability of those elements (e.g., if the buildings are concrete or wood, or the population's age). This data must be supplied by the user to complete the full risk equation.