API Quick Start
FastFlood API – Quick Start
The FastFlood API allows you to run flood simulations and hazard analyses by sending a single JSON request.
Typical use cases include:
-
Flood hazard mapping
-
Forecast-based flood simulations
-
Dam-break scenarios
-
Terrain preprocessing
-
Custom rainfall or inflow events
The API automatically handles terrain data, hydrology, and hydrodynamics based on the inputs you provide.
THe self-documenting FastAPI page is available here https://webapp-prod-fastflood.azurewebsites.net/docs#/model/run_model_v1_model_run_and_wait_post
API Endpoint
Send a POST request with a JSON payload to run a simulation.
Authorization: Bearer YOUR_API_KEY
Example using curl:
-H "Content-Type: application/json" \
-H "Authorization: Bearer YOUR_API_KEY" \
-d @request.json
Coordinate Format
Bounding boxes must use the following format:
Example:
This defines the west, north, east, south boundaries of the model domain.
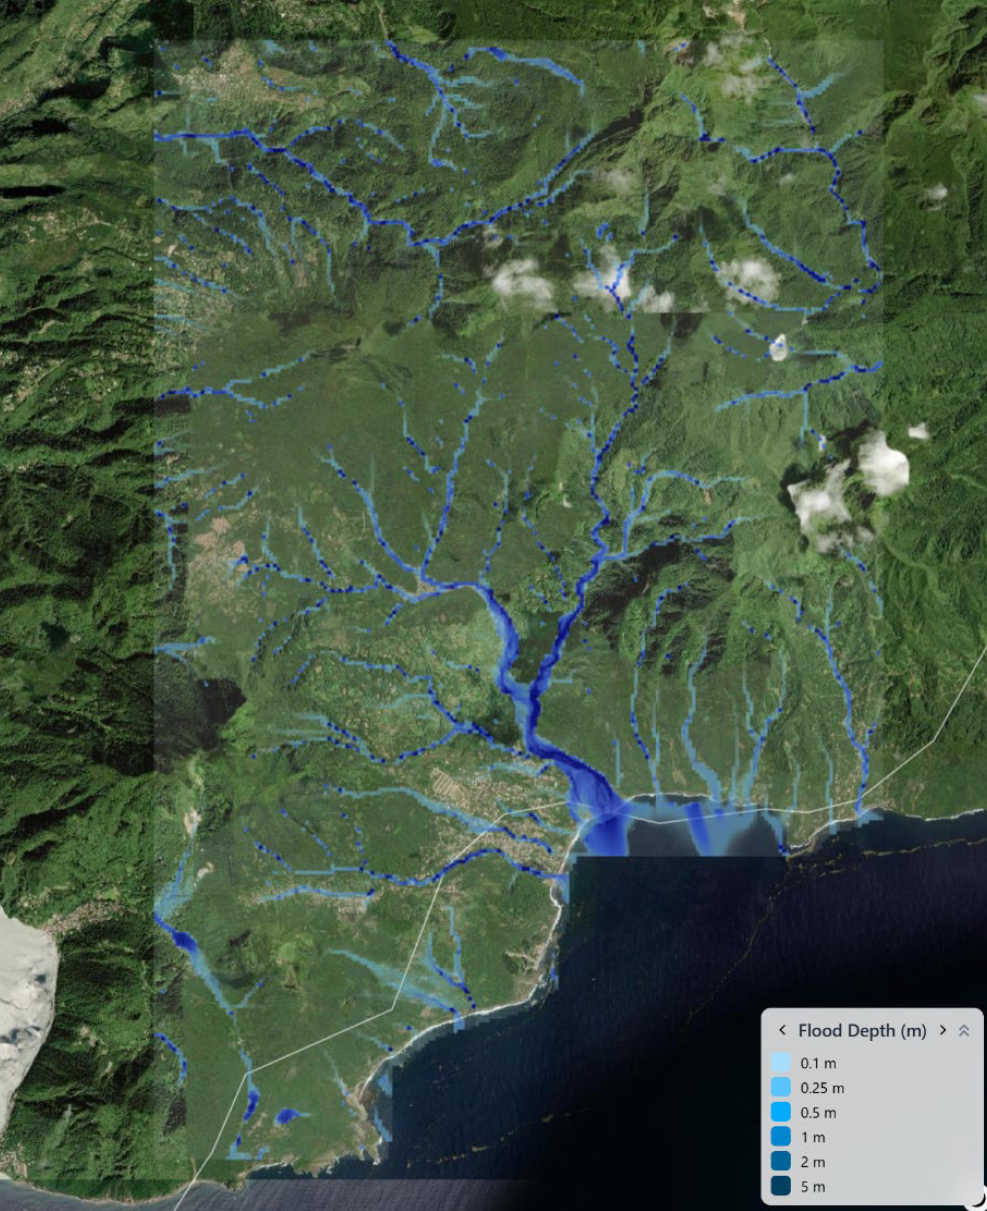
Example 1 — Quick Hazard Map
The fastest way to generate a flood hazard map.
Request
"autohazard": {
"bbox": [
5.9355,
52.2124,
5.9868,
52.1810
],
"return_period": 100,
"scenario": "flashfloodfluvialflood",
"resolution": "medium"
}
}
Parameters
| Parameter | Description |
|---|---|
| bbox | Model area bounding box |
| return_period | Flood return period in years |
| scenario | Hazard scenario type |
| resolution | low, medium, or high |
Use case
-
Rapid flood hazard screening
-
National hazard mapping
-
First analysis for new regions
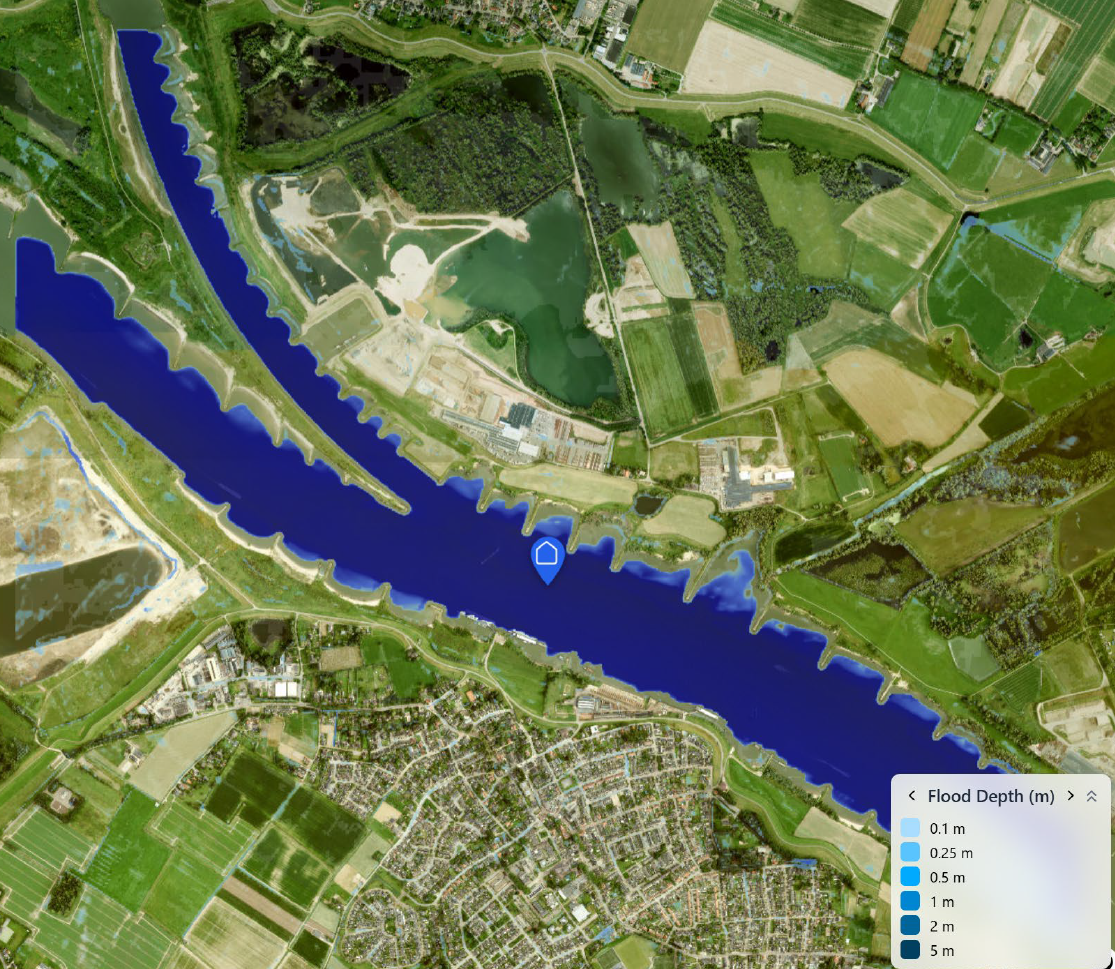
Example 2 — Flood Forecast Simulation
Run a simulation using the latest rainfall forecast.
Request
"autoforecast": {
"bbox": [
6.0167,
51.8867,
6.0676,
51.8553
],
"date": "latest",
"scenario": "flashfloodfluvialflood",
"start_time": 0,
"end_time": 150,
"resolution": "high"
}
}
Parameters
| Parameter | Description |
|---|---|
| date | Forecast date or latest |
| start_time | Forecast start hour |
| end_time | Forecast end hour |
| scenario | Flood scenario combination |
| resolution | Model resolution |
Use case
-
Early warning systems
-
Operational flood forecasting
-
Disaster response support
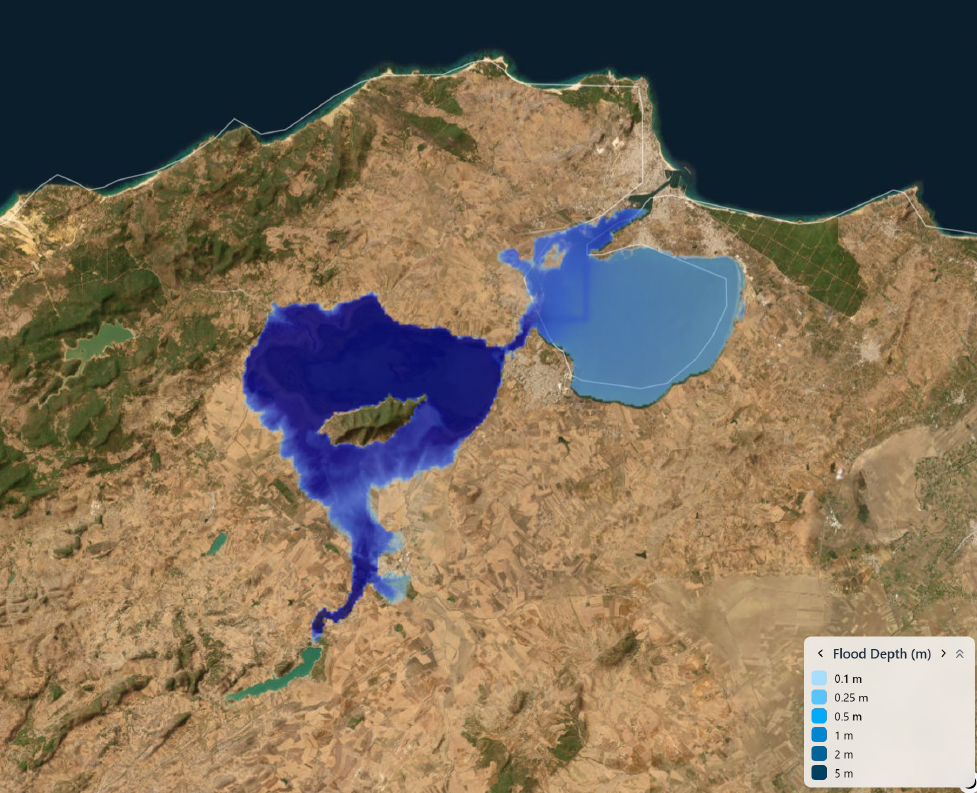
Example 3 — Manual Inflow Event
Simulate a flood caused by a specific discharge source.
Request
"autodem": {
"bbox": [
9.2826,
37.2566,
9.9379,
36.7332
],
"resolution": "medium"
},
"qin": {
"latitude": 36.9949,
"longitude": 9.6103,
"flow_rate": 3826
},
"dur": 1,
"rain": 0
}
Parameters
| Parameter | Description |
|---|---|
| autodem | Automatically download terrain |
| qin | Discharge boundary condition |
| flow_rate | Inflow discharge (m³/s) |
| dur | Event duration (hours) |
| rain | Rainfall intensity |
Use case
-
Dam break simulations
-
Reservoir release analysis
-
River overflow scenarios
Example 4 — Rainfall Event with Custom DEM
Run a simulation using your own terrain and rainfall data.
"dem": {
"url": "https://example.com/dem.tif"
},
"rain": 25,
"dur": 3,
"man": 0.05,
"inf": 0.002,
"pseudomercator": true
}
Use case
-
Research modelling
-
Custom hydraulic studies
-
High-resolution local modelling
Example Response
The API returns a standard response containing links to model outputs.
"status_code": 200,
"message": "Model executed successfully",
"data": {
"files": [
{
"name": "whout.tif",
"href": "https://..."
}
]
},
"errors": null
}
Output files are typically available for 24 hours via cloud storage.
Typical Output Files
| File | Description |
|---|---|
| whout.tif | Flood depth map |
| qout.tif | Peak discharge |
| vel.tif | Flow velocity |
| dem.tif | Model terrain |
| channel.geojson | River network |
| bcond.geojson | Boundary conditions |
| stdout.txt | Model logs |
These outputs can be visualized directly in GIS tools or web mapping libraries.
Recommended First Request
If you are new to the API, start with the hazard request:
This automatically configures all required model components and produces a ready-to-use flood hazard map.
✅ Tip:
Start with small bounding boxes (1–5 km) to keep simulations fast.