Hazard Maps
Using more customized scenarios for hazard maps
What if you don't want to see the current forecast, but want to model a "what-if" scenario, like a 1-in-100-year storm? This is called a "Design Event."
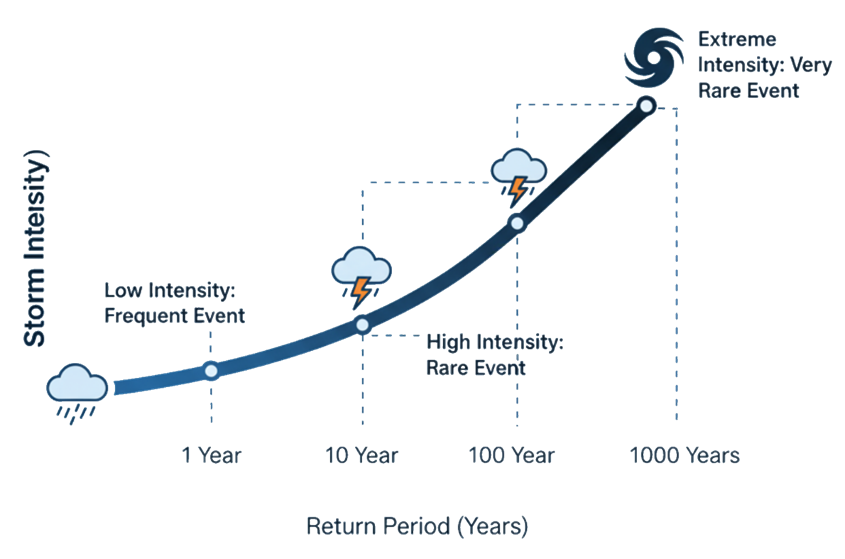
Design Storms & Return Periods
You can test how an area would handle different types of floods by using "design events". These are often described by a "return period," like a 1-in-100-year storm, which represents a very intense storm that has a 1% chance of happening in any given year. The concept of return periods is frequently used to see what level of extremeness is associated to some event,
or how an area might respond to some event with such a level of extremeness.
- Add Your Area: Click the "+ Add Area" button, or click anywhere on the map outside your previous simulation.
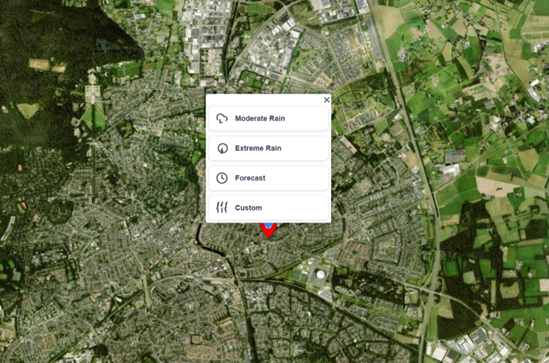
- Define Your Event: Instead of "Forecast," you will create a new scenario using the design storm concept. Click on moderate or extreme to immediately see a new simulation result. Or press custom to follow step 3 and set your own custom scenario.
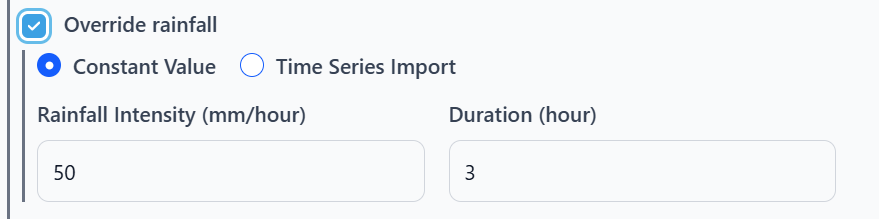
- Set Your Parameters: In the "Configure simulation" panel, you can now define the storm. The platform makes this easy. You don't need to find the data; just set the level of extremeness.
- Return Period (Years): e.g. 50 years
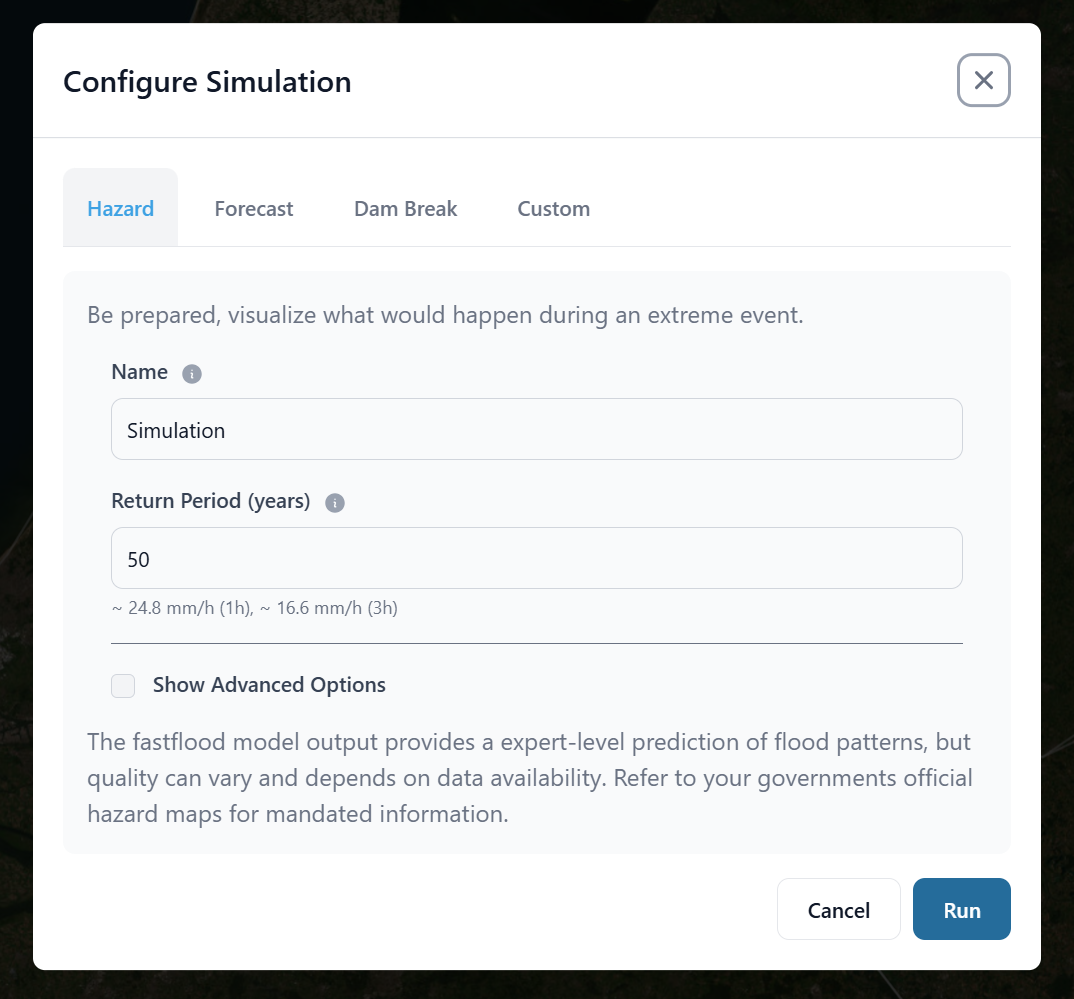
- Run Simulation: The platform automatically finds the correct statistical rainfall for that location and runs the simulation.
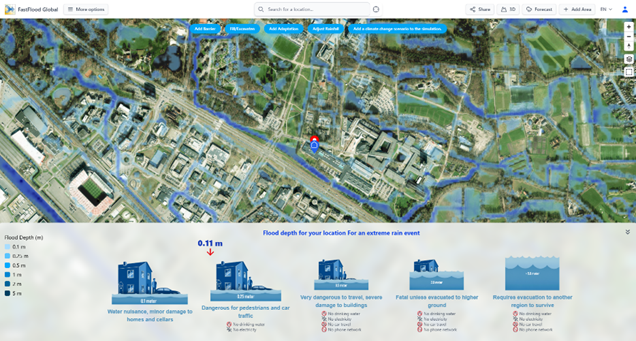
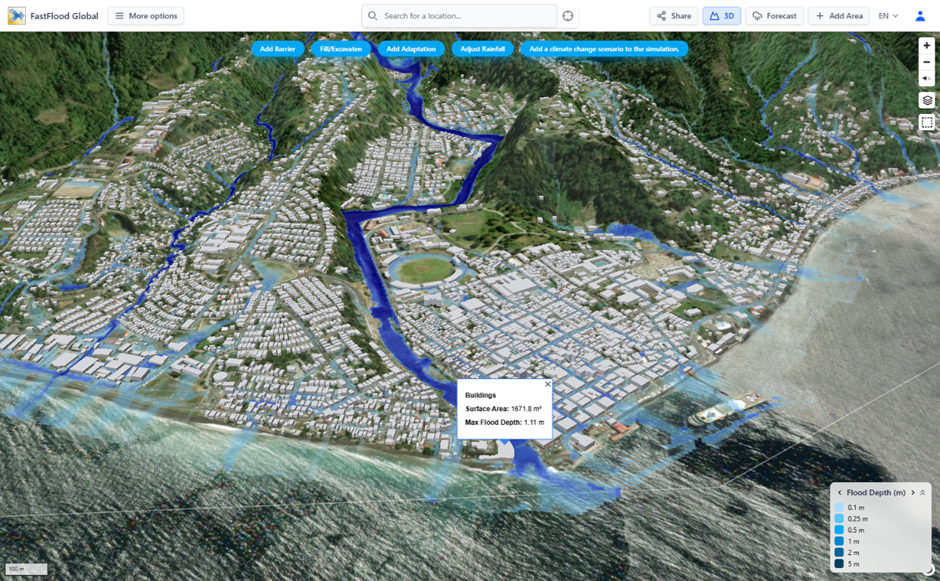
- View in 3D: Click the "3D" button in the top menu. You can now fly through your simulation, seeing exactly how the water interacts with 3D buildings and terrain. This gives you a powerful, intuitive understanding of the flood risk.
Specify your own precipitation data
To specify your own precipitation data, you can load intensity/duration pairs, or import a csv file with time in hours and precipitation in mm/hour in the first and second column.
❓ Questions & Answers
- What is the difference between a "Digital Surface Model" (DSM) and a "Digital Terrain Model" (DTM), and which one is FastFlood Global using?
- Answer: A DSM includes the elevation of everything on the surface, including buildings and tree canopies. A DTM represents the "bare earth" elevation. For accurate flood modeling, a DTM is crucial; using a DSM can cause buildings and trees to merge into a single, unrealistic "wall" that incorrectly blocks water flow. FastFlood Global automatically uses a DTM, which it creates by applying a custom, high-speed filtering algorithm to the global (DSM) elevation data to digitally "remove" buildings and vegetation.
- I'm modeling a "100-year storm." How does the model know the rainfall for this, and why does the rainfall intensity change if I make my area larger or smaller?
- Answer: The model uses a concept called Intensity-Duration-Frequency-Space (IDFS) curves. Instead of a single "100-year storm" value, it has a database of storm statistics (derived from ERA5 and GPM data) for different durations (e.g., 3 hours vs. 24 hours) and, critically, for different spatial sizes. A 100-year storm in a single 10km grid cell is much more intense than a 100-year storm averaged over an entire 5,000 km² river basin. The model automatically scales the rainfall intensity to be statistically correct for the size of the area you are analyzing.
- The 3D view shows water flowing around 3D buildings. Does this mean the 3D building models are blocking the water in the simulation?
- Answer: No, this is an important distinction. The 3D buildings are for visualization and exposure analysis only; they are sourced from OpenStreetMaps. The flood simulation itself is run on the DTM (bare earth), which has had the buildings removed. This ensures the water flows correctly down streets and open terrain. The final step is to overlay the 3D building models on top of the final flood map for a realistic visualization.